Weights
Weights
This module contains functions to generate phase distribution maps. Generate simple maps using espm.weights.generate_weights or more complex maps using espm.weights.abundance.
Weights creation class
The espm.weights.abundance module implements the class Abundance which is used to create the weights of the phases. The weights are stored in the attribute weights and are normalized to 1.
- class espm.weights.abundance.Abundance(shape_2d, n_phases)[source]
- add_chemical_map(file, element_line, conc_min, conc_max, sigma, phase_id, **kwargs)[source]
Function to add a chemical map extracted from a EDS spectrum image as a phase. A threshold and blurring are automatically applied to the map to suppress noise.
- Parameters:
- filestr
Path to the EDS spectrum image.
- element_linestr
Element line to be used for the chemical map. The corresponding element has to be in the metadata of the spectrum image. For example, if the element is ‘Cu’ and the line is ‘K’, the element_line parameter should be ‘Cu_K’.
- conc_minfloat
Minimum concentration. It has to be between 0.0 and 1.0.
- conc_maxfloat
Maximum concentration. It has to be between 0.0 and 1.0.
- sigmafloat
Sigma parameter for the Gaussian filter. It has to be greater than 0.0. Note that the automatic threshold is applied to the blurred map.
- phase_idint
Index of the phase. It has to be between 1 and n_phases-1.
- **kwargs
Keyword arguments for the get_lines_intensity method of the EDS spectrum image.
- Returns:
- None.
- add_gaussian_ripple(center, width, conc_max, phase_id)[source]
Function to define a gaussian ripple spanning over the whole length of the weights abundance of a defined phase. The concentration is max at the center and 0.0 on the edges.
- Parameters:
- centerint
Position on the mean of the gaussian ripple in pixels.
- widthint
Full width at half maximum of the gaussian in pixels.
- conc_maxfloat
Maximum concentration of the gaussian ripple. It has to be between 0.0 and 1.0.
- phase_idint
Index of the phase. It has to be between 1 and n_phases-1.
- Returns:
- None.
Examples
>>> from espm.weights.abundance import Abundance
>>> from matplotlib import pyplot as plt
>>> shape_2d = (100,100)
>>> n_phases = 2
>>> gaussian_ripple = Abundance(shape_2d, n_phases)
>>> gaussian_ripple.add_gaussian_ripple(50, 15, 1.0, 1)
>>> plt.imshow(gaussian_ripple.weights[:,:,1])
- add_image(image, phase_id, conc_min, conc_max)[source]
Function to add a 2D numpy array as a phase.
- Parameters:
- imagenumpy.ndarray
2D numpy array with the phase. It has to be the same size as the shape_2d parameter.
- phase_idint
Index of the phase. It has to be between 1 and n_phases-1.
- conc_minfloat
Minimum concentration. It has to be between 0.0 and 1.0.
- conc_maxfloat
Maximum concentration. It has to be between 0.0 and 1.0.
- Returns:
- None.
Examples
>>> from espm.weights.abundance import Abundance
>>> import hyperspy.api as hs
>>> from matplotlib import pyplot as plt
>>> shape_2d = (512,512)
>>> n_phases = 2
>>> image = Abundance(shape_2d, n_phases)
>>> data = hs.datasets.example_signals.object_hologram()
>>> image.add_image(data.data, 1, 0.0, 1.0)
>>> plt.imshow(image.weights[:,:,1])
- add_laplacian(seed, phase_id, conc_min, conc_max, size_x=50, size_y=50)[source]
Function to generate smooth noise. The characteristic length scale of the noise variations is defined by the scale_x and scale_y parameters.
- Parameters:
- seedint
Seed for the random number generator.
- phase_idint
Index of the phase. It has to be between 1 and n_phases-1.
- conc_minfloat
Minimum concentration. It has to be between 0.0 and 1.0.
- conc_maxfloat
Maximum concentration. It has to be between 0.0 and 1.0.
- size_xint, optional
characteristic length scale of the noise variations in the x direction. The default is 50.
- size_yint, optional
characteristic length scale of the noise variations in the y direction. The default is 50.
- Returns:
- None.
Examples
>>> from espm.weights.abundance import Abundance
>>> from matplotlib import pyplot as plt
>>> shape_2d = (100,100)
>>> n_phases = 2
>>> laplacian = Abundance(shape_2d, n_phases)
>>> laplacian.add_laplacian(1, 1, 0.0, 1.0, 10, 10)
>>> plt.imshow(laplacian.weights[:,:,1])
- add_random(seed, phase_id, conc_min, conc_max)[source]
Function to generate random noise.
- Parameters:
- seedint
Seed for the random number generator.
- phase_idint
Index of the phase. It has to be between 1 and n_phases-1.
- conc_minfloat
Minimum concentration. It has to be between 0.0 and 1.0.
- conc_maxfloat
Maximum concentration. It has to be between 0.0 and 1.0.
- Returns:
- None.
Examples
>>> from espm.weights.abundance import Abundance
>>> from matplotlib import pyplot as plt
>>> shape_2d = (100,100)
>>> n_phases = 2
>>> random = Abundance(shape_2d, n_phases)
>>> random.add_random(1, 1, 0.0, 1.0)
>>> plt.imshow(random.weights[:,:,1])
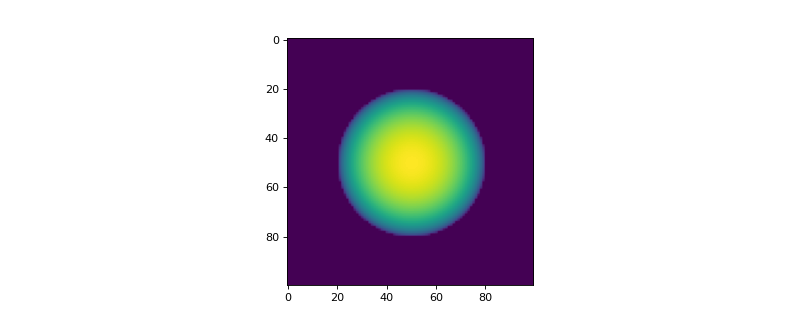
- add_sphere(ind_origin, radius, conc_max, phase_id, asym_x=1.0, asym_y=1.0)[source]
Function to define a sphere abundance of a defined phase. The concentration is max at centre and 0.0 on the edges.
- Parameters:
- ind_origintuple of integers
Coordinates of the centre of the sphere.
- radiusfloat
Radius of the sphere in pixels.
- conc_maxfloat
Maximum concentration of the sphere.
- phase_idint
Index of the phase
- asym_xfloat, optional
Asymmetry of the sphere in the x direction. The default is 1.0.
- asym_yfloat, optional
Asymmetry of the sphere in the y direction. The default is 1.0.
- Returns:
- None.
Examples
>>> from espm.weights.abundance import Abundance
>>> from matplotlib import pyplot as plt
>>> shape_2d = (100,100)
>>> n_phases = 2
>>> sphere = Abundance(shape_2d, n_phases)
>>> sphere.add_sphere((50,50), 30, 1.0, 1)
>>> plt.imshow(sphere.weights[:,:,1])
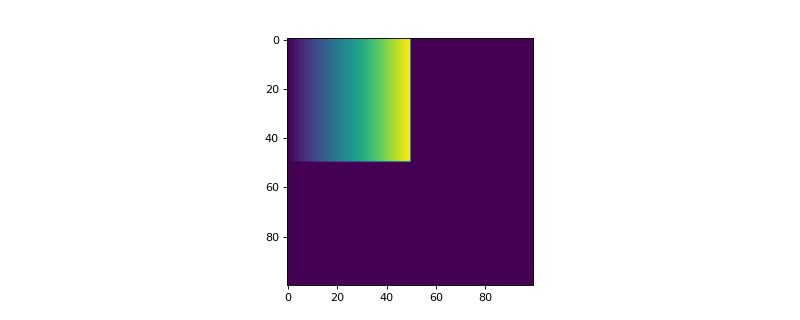
- add_wedge(ind_origin, length, width, conc_min, conc_max, phase_id)[source]
Function to define a wedge abundance of a defined phase. The concentration is max at the top and min at the bottom.
- Parameters:
- ind_origintuple of integers
Coordinates of the top left corner of the wedge. It has to be inside the current weights, i.e. ind_origin[0] + length <= self.shape_2d[0] and ind_origin[1] + width <= self.shape_2d[1].
- lengthint
Length of the wedge in pixels.
- widthint
Width of the wedge in pixels.
- conc_minfloat
Minimum concentration of the wedge. It has to be between 0.0 and 1.0.
- conc_maxfloat
Maximum concentration of the wedge. It has to be between 0.0 and 1.0.
- phase_idint
Index of the phase. It has to be between 1 and n_phases-1.
- Returns:
- None.
Examples
>>> from espm.weights.abundance import Abundance
>>> from matplotlib import pyplot as plt
>>> shape_2d = (100,100)
>>> n_phases = 2
>>> wedge = Abundance(shape_2d, n_phases)
>>> wedge.add_wedge((0,0), 50, 50, 0.0, 1.0, 1)
>>> plt.imshow(wedge.weights[:,:,1])
- check_add_weights(val, phase_id)[source]
Check if the sum of the weights is below 1. If it is, add the new abundance. If not, print a message.
- Parameters:
- valarray
Array of the new abundance.
- phase_idint
Index of the phase. It has to be between 1 and n_phases-1.
- Returns:
- None.
- scale_phase(values, conc_min, conc_max)[source]
Scale the values of a phase between conc_min and conc_max. If the values are all zero, the function returns the values without scaling.
- Parameters:
- valuesarray
Array of the abundance to scale.
- conc_minfloat
Minimum concentration of the phase. It has to be between 0.0 and 1.0.
- conc_maxfloat
Maximum concentration of the phase. It has to be between 0.0 and 1.0.
- Returns:
- scaled_valuesarray
Array of the scaled abundance.
- property weights
Predetermined weights
The :mod: espm.weights.generate_weights module implements functions to generate predetermined weights to quickly and easily generate spatial phase distributions. For a more advanced weights creation, see the :mod: espm.weights.abundance module.
- espm.weights.generate_weights.chemical_map_weights(file=None, line_list=[], conc_list=[], **kwargs)[source]
Generate a weight matrix based on an experimental EDS spectrum image. For each selected line a map is generated with the corresponding concentration.
- Parameters:
- shape_2dtuple, optional
Shape of the weight matrix. The default is [80, 80].
- filestr, optional
Path to the EDS spectrum image. If None, the function does nothing.
- line_listlist, optional
List of lines to be used. The default is []. If line_list is empty, the function does nothing. The lines must be in the form of a string, e.g. “Fe_Ka”.
- conc_listlist, optional
List of concentrations for each line. The default is []. If conc_list is empty, the concentration of each line is set to 1/len(line_list).
- Returns:
- weightsnumpy.ndarray
Weight matrix with chemical map distribution.
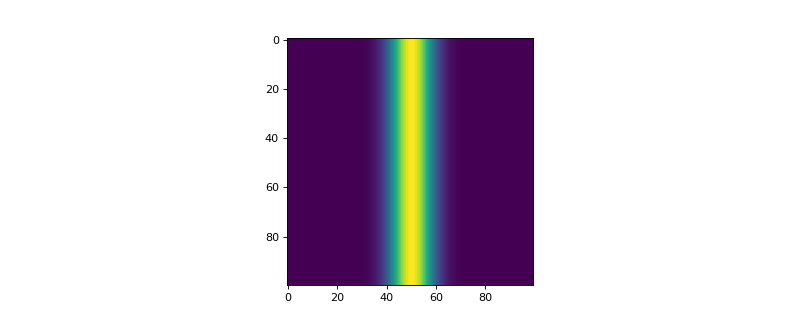
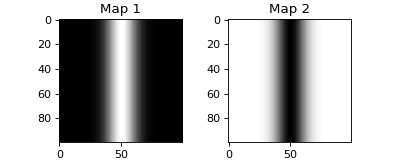
- espm.weights.generate_weights.gaussian_ripple_weights(shape_2d, width=1, seed=0, **kwargs)[source]
Generate a weight matrix with a gaussian ripple of the given width and randomly centered.
- Parameters:
- shape_2dtuple
Shape of the weight matrix.
- widthint, optional
Width of the gaussian ripple. The default is 1.
- seedint, optional
Seed for the random number generator. The default is 0. If seed is 0, the gaussian ripple is centered at half the second dimension of the weight matrix.
- Returns:
- weightsnumpy.ndarray
Weight matrix with gaussian ripple distribution.
Examples
>>> from espm.weights.generate_weights import gaussian_ripple_weights
>>> import matplotlib.pyplot as plt
>>> weights = gaussian_ripple_weights((100,100), 20, 0)
>>> fig = plt.figure(figsize=(5,2))
>>> axs = fig.subplots(1,2)
>>> for i in range(2):
...     axs[i].imshow(weights[:,:,i], cmap=plt.cm.gray_r)
...     axs[i].set_title(f"Map {i+1}")
>>> fig.show()
- espm.weights.generate_weights.generate_weights(weight_type, shape_2d, n_phases=3, seed=0, **params)[source]
Generate a weight matrix with the given type. Additional parameters can be passed to the function as keyword arguments.
- Parameters:
- weight_typestr
Type of weight matrix. Accepted types : random, laplacian, sphere, gaussian_ripple, wedge, toy_problem, chemical_map.
- shape_2dtuple
Shape of the weight matrix.
- n_phasesint, optional
Number of phases. The default is 3. The first phase is the complementary of the other phases.
- seedint, optional
Seed for the random number generator. The default is 0.
- **paramsdict
Additional parameters for the weight matrix generation. See the documentation of the corresponding function for more details.
- Returns:
- weightsnumpy.ndarray
Weight matrix with the given type.
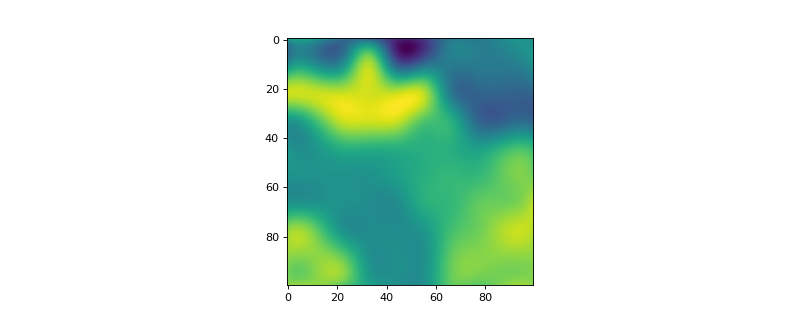
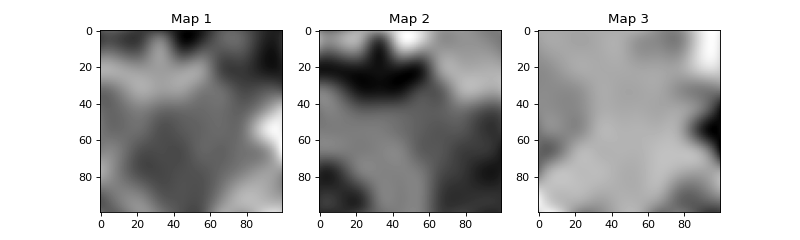
- espm.weights.generate_weights.laplacian_weights(shape_2d, n_phases=3, seed=0, size_x=10, size_y=10, **kwargs)[source]
Generates a random weight matrix with a laplacian distribution.
The random weight are then filtered with median filter 2 times to smooth the distribution. Eventually, the result is normalized to sum up to one.
- Parameters:
- shape_2dtuple
Shape of the weight matrix.
- n_phasesint, optional
Number of phases. The default is 3.
- seedint, optional
Seed for the random number generator. The default is 0.
- Returns:
- weightsnumpy.ndarray
Weight matrix with laplacian distribution.
Examples
>>> import numpy as np
>>> import matplotlib.pyplot as plt
>>> from espm.weights.generate_weights import laplacian_weights
>>> weights = laplacian_weights((100,100), 3, 0)
>>> fig = plt.figure(figsize=(10,3))
>>> axs = fig.subplots(1,3)
>>> for i in range(3):
...     axs[i].imshow(weights[:,:,i], cmap=plt.cm.gray_r)
...     axs[i].set_title(f"Map {i+1}")
>>> fig.show()
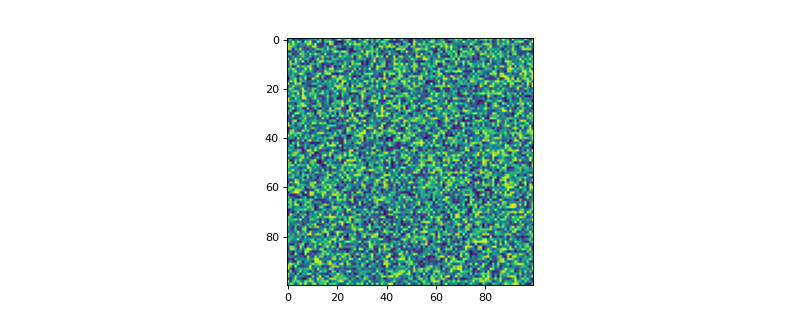
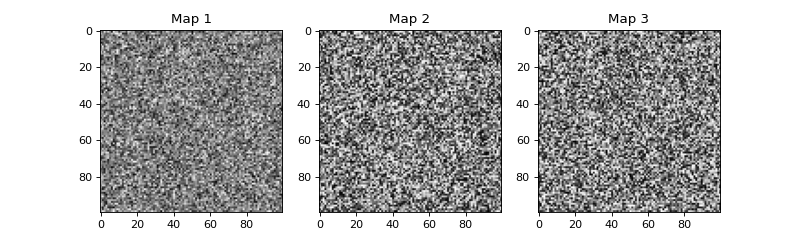
- espm.weights.generate_weights.random_weights(shape_2d, n_phases=3, seed=0)[source]
Generates a random weight matrix with a uniform distribution.
The random weights are then normalized to sum up to one.
- Parameters:
- shape_2dtuple
Shape of the weight matrix.
- n_phasesint, optional
Number of phases. The default is 3.
- seedint, optional
Seed for the random number generator. The default is 0.
- Returns:
- weightsnumpy.ndarray
Weight matrix with uniform distribution.
Examples
>>> from espm.weights.generate_weights import random_weights
>>> import matplotlib.pyplot as plt
>>> weights = random_weights((100,100))
>>> fig = plt.figure(figsize=(10,3))
>>> axs = fig.subplots(1,3)
>>> for i in range(3):
...     axs[i].imshow(weights[:,:,i], cmap=plt.cm.gray_r)
...     axs[i].set_title(f"Map {i+1}")
>>> fig.show()
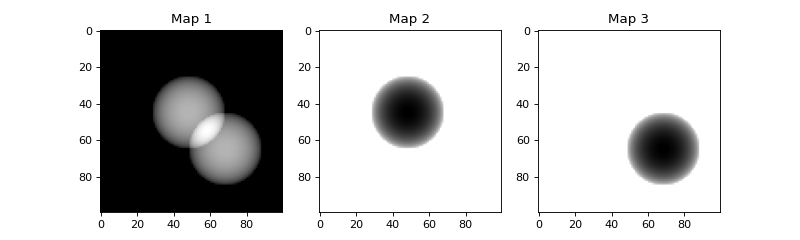
- espm.weights.generate_weights.spheres_weights(shape_2d=[80, 80], n_phases=3, seed=0, radius=1, **kwargs)[source]
Generate a weight matrix with randomly placed spheres of the given radius.
- Parameters:
- shape_2dtuple, optional
Shape of the weight matrix. The default is [80, 80].
- n_phasesint, optional
Number of phases. The default is 3. The first phase is the complementary of the other phases.
- seedint, optional
Seed for the random number generator. The default is 0.
- radiusint, optional
Radius of the spheres in pixels. The default is 1.
- Returns:
- weightsnumpy.ndarray
Weight matrix with spheres distribution.
Examples
>>> from espm.weights.generate_weights import spheres_weights
>>> import matplotlib.pyplot as plt
>>> weights = spheres_weights((100,100), 3, 0, 20)
>>> fig = plt.figure(figsize=(10,3))
>>> axs = fig.subplots(1,3)
>>> for i in range(3):
...     axs[i].imshow(weights[:,:,i], cmap=plt.cm.gray_r)
...     axs[i].set_title(f"Map {i+1}")
>>> fig.show()
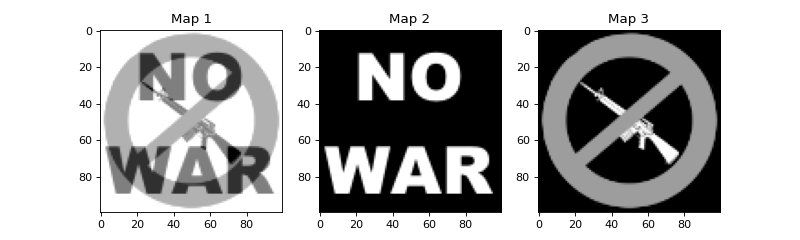
- espm.weights.generate_weights.toy_weights(**kwargs)[source]
Load the toy problem weights.
- Returns:
- Hdotnp.ndarray
The weights of the toy problem.
Examples
>>> from espm.weights.generate_weights import toy_weights
>>> import matplotlib.pyplot as plt
>>> weights = toy_weights()
>>> fig = plt.figure(figsize=(10,3))
>>> axs = fig.subplots(1,3)
>>> for i in range(3):
...     axs[i].imshow(weights[:,:,i], cmap=plt.cm.gray_r)
...     axs[i].set_title(f"Map {i+1}")
>>> fig.show()
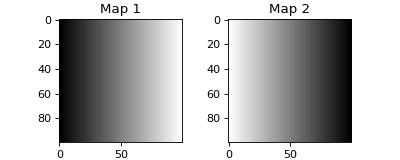
- espm.weights.generate_weights.wedge_weights(shape_2d=[80, 80])[source]
Generate a weight matrix with a wedge of phase 2 and complementary phase 1.
- Parameters:
- shape_2dtuple, optional
Shape of the weight matrix. The default is [80, 80].
- Returns:
- weightsnumpy.ndarray
Weight matrix with wedge distribution.
Examples
>>> from espm.weights.generate_weights import wedge_weights
>>> import matplotlib.pyplot as plt
>>> weights = wedge_weights((100,100))
>>> fig = plt.figure(figsize=(5,2))
>>> axs = fig.subplots(1,2)
>>> for i in range(2):
...     axs[i].imshow(weights[:,:,i], cmap=plt.cm.gray_r)
...     axs[i].set_title(f"Map {i+1}")
>>> fig.show()